Monitoring Navigator Audit Service Health
Cloudera recommends monitoring the Navigator Audit Service to ensure that it is always running. This is especially important to ensure that complete and immutable audit records will be available when needed for corporate governance and compliance purposes.
The Navigator Audit Service has a self-check mechanism, the Audit Pipeline Health Check, that generates warning messages when the system slows down or fails. The health check determines failures and slow downs by keeping track of the number of bytes of audit data sent, bytes unsent, or failures during the send process that occur within the monitoring window. Healthy state for a given monitoring period results when all audit data is sent (no data remaining), with error-free transmission from agent to server.
The health check can be run for each service role instance (daemon) that can generate events. By default, all service role groups are selected when you enabled the health check, and the default monitoring period is 20 minutes. Thresholds for warning messages and the monitoring period are configurable using the Cloudera Manager Admin, as detailed below.
Configuring the Audit Pipeline Health Check
- Select .
- Click the Configuration tab.
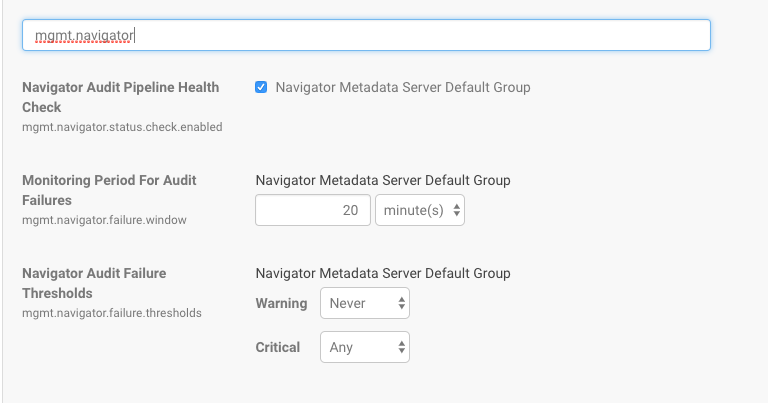
- In the Search field, type mgmt.navigator to display the health check configuration properties for the service:

- Modify the settings to shorten (or lengthen) the monitoring period as needed for your system and set bytes for Warning and Critical thresholds.
Property Description Navigator Audit Pipeline Health Check Check the box to enable the health check. Health check can be enabled for specific groups. By default, the health check is enabled for all groups. Monitoring Period for Audit Failures Default is 20 minutes. The amount of time to process audit events (count processed and evaluate other metrics before generating warnings. Navigator Audit Failure Thresholds Size (in bytes) of failures that will trigger messages. - Warning—Default is Never. Set this to an amount of bytes and condition (which to trigger a warning message.
- Critical—Default is Any, meaning that any amount of failed audit data sent from Cloudera Manager to the server will trigger a critical message.
- Click Save Changes.
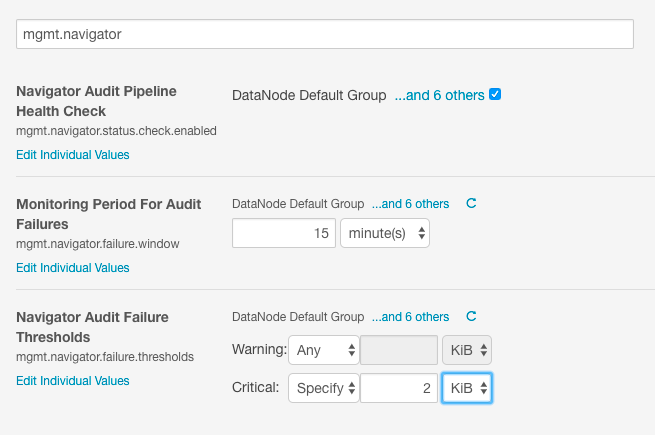
For example, as shown in the Cloudera Manager Admin Console, the pipeline health check is enabled for all groups in the service. The failure period is set to 15 minutes, and the health check sends a warning for failures of any size and a critical error when 2 KiB of audit events have not been sent.

| << Adding Audit Filters | ©2016 Cloudera, Inc. All rights reserved | Publishing Audit Events >> |
| Terms and Conditions Privacy Policy |